
Ambient Sound-Level Monitoring During Surveys
Overview
While a participant has a survey open, the app can measure the loudness of the surrounding sound environment and record a compact set of summary statistics. It does not record, store, or transmit any audio. No waveform, speech, or recoverable sound is ever captured — only numeric loudness measurements are produced.
The feature is designed so that the participant's acoustic environment can be characterized (e.g., "was this survey answered in a quiet or noisy setting?") without any recording that could compromise privacy.
When it runs
Sound-level monitoring is active only while a survey is open and the app is in the foreground. It is governed by study configuration and only operates when:
• the feature is enabled for the study,
• amplitude mode is selected, and
• the participant has granted microphone permission.
It starts automatically when a survey opens and stops when the survey is completed or closed. It automatically pauses if the participant leaves the app (backgrounds it) or if the survey itself plays audio/video, and resumes when they return or the playback ends. This ensures measurements reflect the participant's environment during active survey-taking, and that the feature never competes with the survey's own audio.
When Amplitude is active, a small red indicator appears next to the survey's Next button so that the participant can see at a glance that ambient sound-level monitoring is running:
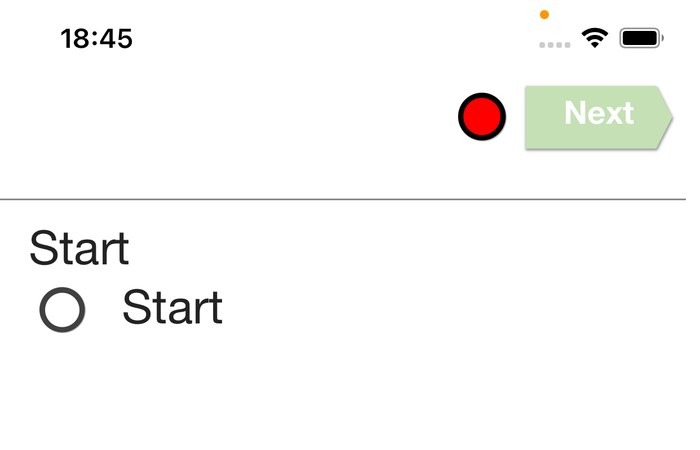
Survey screen — the red indicator next to the Next button shows monitoring is running.
How a measurement is produced
1. The microphone is sampled continuously at a high rate (44.1 kHz, mono). Where the device supports it, an unprocessed microphone path is used (no automatic gain control, echo cancellation, or noise suppression), so the readings reflect the true ambient level rather than a phone-altered signal.
2. The incoming sound is divided into short ~100-millisecond slices. For each slice the app computes its instantaneous peak level and its average (RMS) level.
3. These slices are accumulated over a configurable measurement window (for example, 30 seconds). At the end of each window the app computes a row of summary statistics from all the slices in that window and saves it.
4. Optionally a gap can be configured between windows (e.g., measure for 30 s, then idle for 15 minutes, repeat). With a gap of zero, windows run back-to-back for the duration the survey is open.
All levels are expressed in dBFS (decibels relative to full scale). In this scale, 0 dBFS is the loudest the microphone can represent, and more-negative numbers mean quieter. A typical quiet room reads strongly negative (e.g., −50 to −70 dBFS); loud environments approach 0.
Data collected (per measurement window)
Each completed window produces one record with the following fields.
Acoustic measurements
Timing and context
Identifiers
Linking the measurement to a participant and survey.
Example report generated by the app HERE.
What is not collected
• No audio is recorded or stored. There is no audio file, no waveform, and nothing from which speech or sound content could be reconstructed. Only the numeric statistics above are produced.
• The app does not perform speech recognition, transcription, or content analysis as part of this feature.
Configurable study parameters
Researchers can tune the feature per study. The study configuration page exposes the EAR mode and parameters; Amplitude recording requires the Amplitude mode and the EAR Parameter Assessment Enabled toggle:
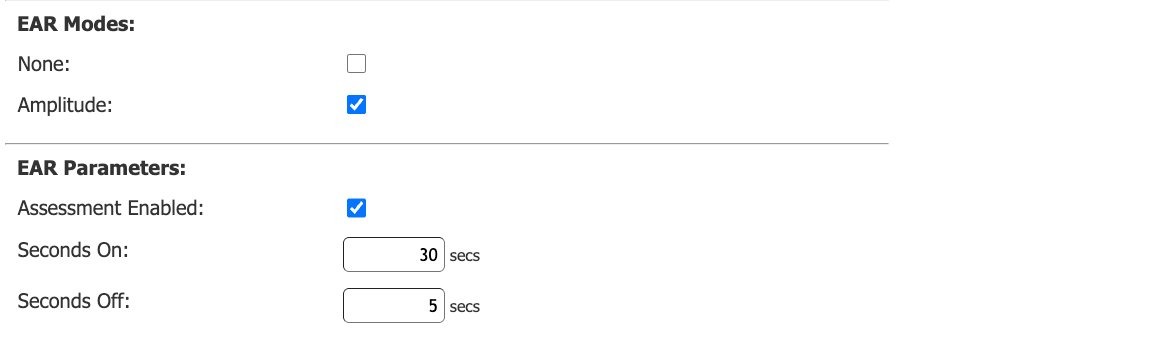
Study configuration — EAR mode set to Amplitude, Assessment Enabled, with Seconds On / Seconds Off.
• Window length (secsOn) — how long each measurement window lasts (e.g., 30 s).
• Gap between windows (secsOff) — idle time between windows (0 = continuous).
• Enablement — whether the feature runs at all, and only in amplitude (statistics-only) mode.
In addition, microphone permission must be enabled at the study level so the app requests it from the participant. This is set under Misc Parameters → Audio Enabled:
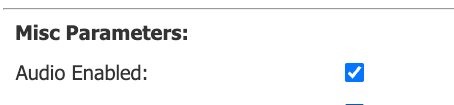
Misc Parameters — Audio Enabled must be checked for the app to request microphone permission.
Interpreting the data
• Use leq as your primary loudness measure; average is a simpler companion.
• Use floor vs peak to understand the range between background quiet and loudest events.
• Use stddev to distinguish steady environments (e.g., a quiet office) from dynamic ones (e.g., a busy street or conversation).
• Treat clipping_pct and samples as data-quality flags: high clipping means readings may be capped; low sample counts mean a short or interrupted window.
• Every row is tied to a specific survey occasion via svy_id / svy_ts and a participant via rsp_id, so loudness can be joined directly to survey responses for context (e.g., correlating self-reported stress with ambient noise).
Quick reference